To start, a list of Jargon, Concepts, Variables, and Acronyms:
- BAC
- MOA and sub MOA
- Rayleigh Distribution
- σ and Mean Radius
- Accuracy Indicators (MR, P1x, ES, etc.)
- Computing P1x from CEPYY
Many rifle and component manufacturers guarantee MOA or even Sub MOA performance from their products. Claims of MOA and sub MOA weapon performance is prolific within the shooting community. Using the Ballistic Accuracy Classification system (BAC™) I will show how the different weapon classes within BAC relate to plausible claims of MOA and sub MOA accuracy.
To begin, we neglect environmental effects, especially wind, precipitation, air temperature, and the rest, and choose to focus on effects of rifle, shooter, and ammunition. Essentially, we’re looking at effects that dominate shooting rifles from the bench at 50 to 100 yards. These effects extend to longer ranges and different shooting positions, but these scenarios must consider environmental effects and shooter skill which are neglected in this discussion.
Weapon accuracy is described by the Rayleigh distribution, which is just a two-dimensional version of the common Normal or Gaussian distribution. It even uses the same parameter (sigma) to characterize the radial dispersion of shots on a target. BAC defines several classes of weapon accuracy based on the single Rayleigh distribution statistical parameter, σ (sigma), which is the Rayleigh analog of the standard deviation for Gaussian distributions. Each of the classes corresponds to a σ that is 1/10 of the designation of the class. In this way, Class 2 has a σ of 0.2, Class 4 has a σ of 0.4, and so on.
For a given weapon system (by which I mean weapon, ammunition, and shooting scenario), once σ is known, and thus the weapon class has been defined, all sorts of interesting information can be readily computed for the weapon. For example, the Mean Radius (MR) of a class is approximately 1.25 times the σ parameter of that class. The MR is probably the most useful and easily understandable value to the shooter that can be computed from σ because it represents the EXPECTED, or most probable, distance of a given shot from the true point of aim.
I introduce the term Accuracy Indicator to refer to some measure of a subset of a sample of a shot group, real or simulated, that conveys useful and/or interesting information about the accuracy of the weapon, ammunition, shooter, and combinations thereof, that were involved in shooting the group. Such measures as 3-shot and 5-shot extreme spread, mean radius, vertical standard deviation, horizontal standard deviation, group center, and Point of Aim error are all accuracy indicators.
One of my favorite accuracy indicators is the probability that a single shot will be equal to or closer than some distance from the true point of aim (POA) of the shooter. I will call this indicator the P1x (probability 1 shot less than some x in MOA from true point of aim). The P1x accuracy indicator is practical and interesting for a lot of reasons, including that it is simultaneously its own mean and extreme spread. The P1x is also an inverse of the Circular Error Probable (CEP – i.e. the radius from the true POA for which a given shot is YY% probable, e.g. YY = 90 implies CEP90). While the true point of aim is never known perfectly to the shooter, the statistics reference the P1x indicator from the true POA, and the shooter would like their actual POA to equal the true POA.
CEPYY is computed from σ as

Which is easily inverted to get the P1x result for a given σ, or

Where x is the distance from true POA in question. This can be solved for σ to answer another reasonable question: what σ and x will give me a P1x? For example, suppose we want to know what σ is needed to get a P1-0.5, which is the probability of a single shot landing within 0.5 MOA of the POA, with a probability of 80%. In this case solve for σ to get

With the result that

Which is Class 3.
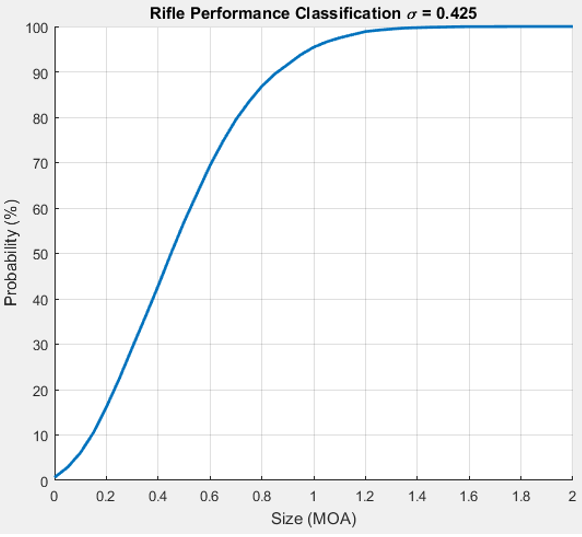
The reason I like this accuracy indicator so much is that it answers the practical question of whether the success of a proposed shot is probable, and exactly how probable. For example, I think most hunters will be happy if their hunting rifle had a P1-0.5 of at least 50%, meaning that the probability that a single shot will land within 0.5 MOA of the true POA is no worse than 50%. In this scenario, the hunter could reasonably expect to make 300 yard shots as the probability of the shot being within 1.5” of the intended target is 1 out of 2. Further, with a 50% P1-0.5, the P1-1.0 turns out to be much higher, 93.7% in fact, so that in our hunting rifle scenario, the hunter could expect a very good chance of their shot being within 3” of their point of aim at 300 yards (plus a small factor to account for discrepancy between true and intended POA). Such a weapon has a σ of 0.425 which puts it at the high end (lower is better) of Class 4 (Class 4 has σ centered at 0.4 and extends from 0.35 to 0.45). The following figure shows the P1x for x between 0 and 2 MOA for a σ 0.425 weapon.

Most rifle shooters, myself included, are inclined to think of accuracy in terms of 3 or 5 shot extreme spread. I will explore the usefulness of this metric as an accuracy indicator and compare with two other accuracy indicators: MR and P1x.
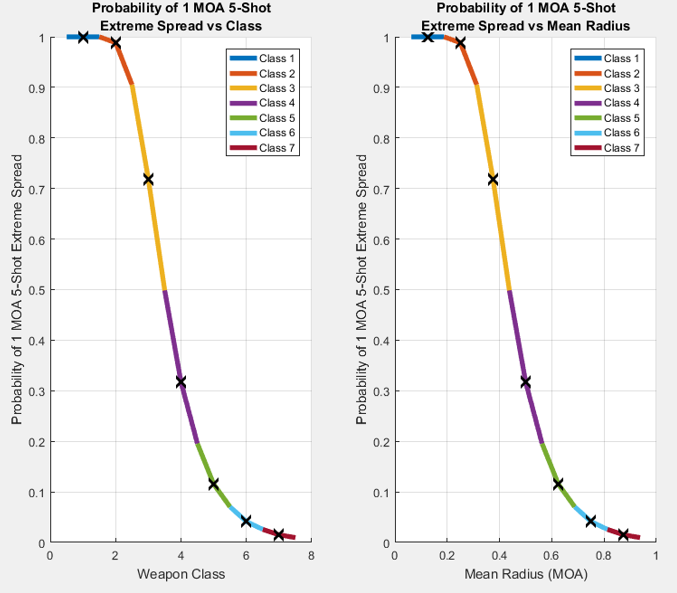
The figure below shows the probability of a 1 MOA or better 5-shot extreme spread (ES) for BAC classes 1 through 7. Note that the range of probability of 1 MOA or better ES is large for some classes (3, and 4) and small for most of the others (1 and 2 at the high accuracy range where the probability is greater than 90%, and 5-7 at the low accuracy range where the probability is less than 20%).
From the above notes and the graph below, it is my opinion that any BAC class that spans more than a 20% range of probability for a given MOA metric can be assumed to be of that ES class. In this case, BAC Class 3 and Class 4 can be reasonably thought of as MOA weapons. In this case, Class 3 is MOA with greater than 50% probability of 5-shot MOA groups while Class 4 is MOA with less than 50% probability of MOA ES. Classes 1 and 2 are what most of us think of as solidly sub MOA, and weapons at the low end of Class 3 are at the high end of sub MOA performance with a solid probability of 0.8 and 0.9 MOA or better 5-shot groups.

A natural question at this point is why not refine the classes so that classes 3 and 4 are broken up into finer regions on the 1 MOA plot? This is a very good question, and one I struggled with as I would like a more refined system as well. There turns out to be a very good answer: It is very difficult to determine the σ of a given weapon system to a finer degree than we are doing with the BAC system.
There are many reasons why this is true. Foremost, the number of shots required to define a BAC class more precisely than 0.1 MOA per class is very high, somewhere between 100 and 1000. Shooting so many shots starts to effect the accuracy of the rifle as the barrel you are shooting at the start of the session is not exactly the same as the on a the end of the session for a lot of reasons. Second, during a given shooting session, shooter fatigue will set in and start to have an increasingly larger effect on the results. There are other reasons but these are the most significant that immediately come to mind.
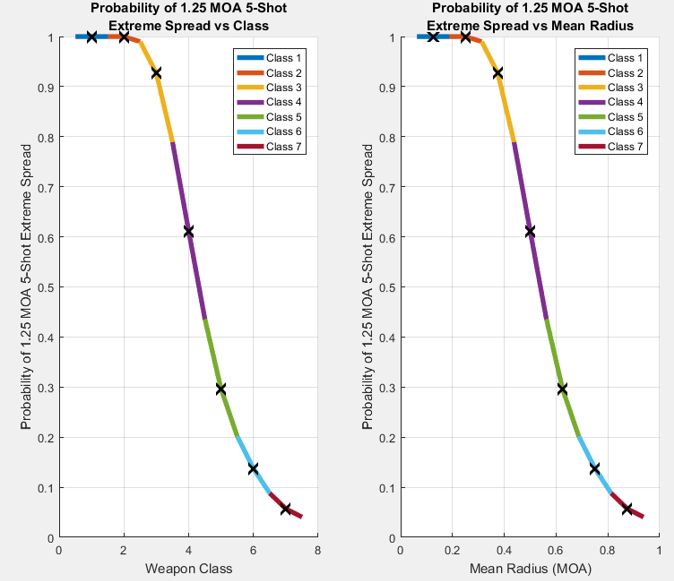
Class 5 is worth further consideration. It is not quite an MOA class according to the discussion so far but it is close. What happens if we extend the size of the 5 shot group under consideration from 1 MOA to 1.25 MOA?

So, a Class 5 weapon can reasonably be considered a 1.25 MOA weapon when thinking in terms of extreme spread. How does a Class 5 weapon stack up in terms of P1-0.5 and P1-1.0 accuracy indicators? It turns out that for the center of Class 5 with σ = 0.5, P1-0.5 equals 39% and P1-1.0 is 86%. I consider this very good for hunting and informal target shooting.
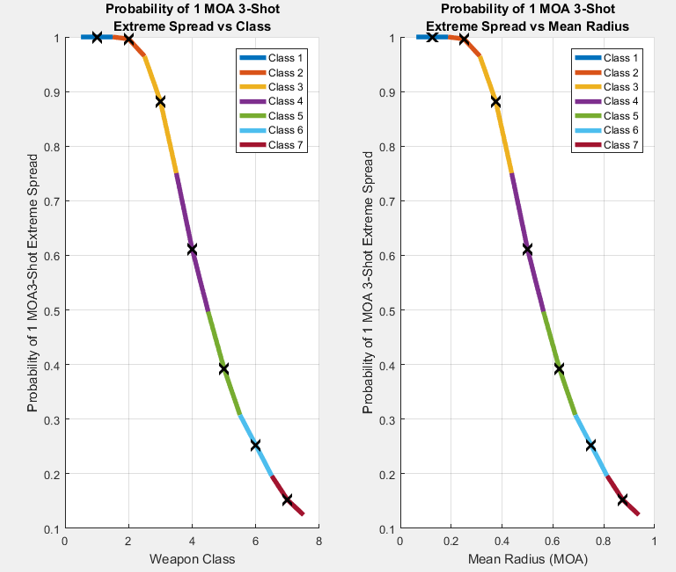
On the other hand, I don’t like individual 3-shot groups for determining accuracy as they are statistically meaningless and they give a false sense of accuracy. Consider the probability of each class of weapon shooting a 3-shot extreme spread at 1 MOA or better:

In this case, Class 5 is solidly an MOA performer as up to 30% to 50% of 3-shot groups are expected to be MOA or better. However, 3 shot groups for selecting ammunition that works well for a given rifle, or for zeroing a scope is a grave mistake, and for those and other reasons I reject 3-shot groups for any serious rifle evaluation. I know if feels awesome to have three shots in close proximity on paper, but take the extra courage and risk blowing the group for the greater good of knowing something closer to the truth. In fact, for serious accuracy determination, I shoot a minimum of 10 shots per group, and I usually combine data from three such groups into a single 30 shot result. I love 5 shot groups for fun and friendly competition, but for evaluation 10+ shot groups are vastly superior.
In my next post I will consider an important aspect of rifle shooting accuracy: the shooter. How can we estimate the accuracy of the shooter, and if this quantity is known, how can the accuracy of the rifle and ammunition be separated from the capability of the shooter with that weapon? Especially important to consider: how the precision of the shooter is effected by the weapon. Deficiencies in shooting technique are exaggerated by lighter weight weapons and cartridges with greater recoil, and the ratio between the two. Hold these thoughts until next time.
Testing comments…